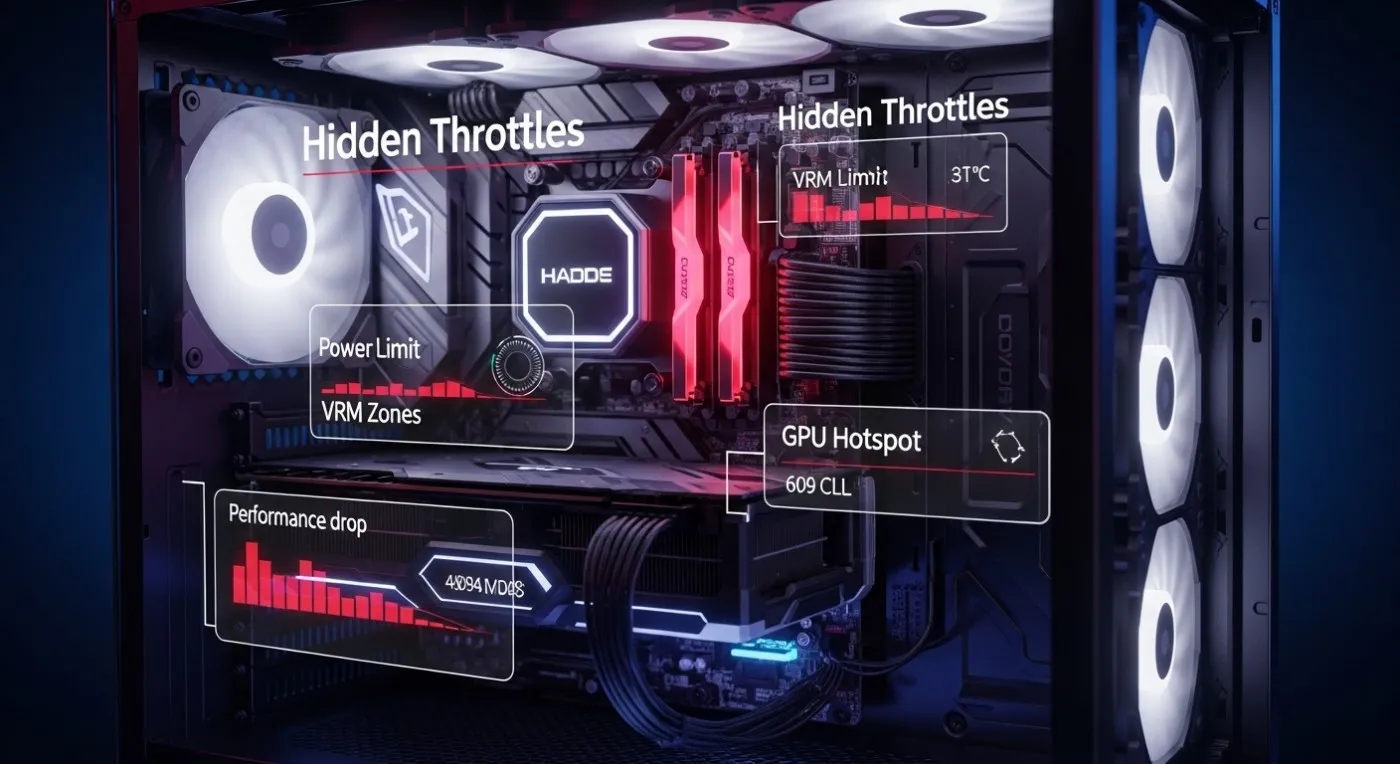
Your temps look normal, but your FPS is having a nervous breakdown. You open HWMonitor or HWiNFO, see your CPU sitting in the 60s and your GPU in the low 70s, and yet the game feels like it is running on a laptop from 2010. No red numbers, no thermal alarms, just random drops and unstable performance. So whats The Hidden Throttles Killing FPS?
Here is the annoying truth. Modern CPUs and GPUs can throttle long before they actually overheat. Power limits, VRM temperatures, hotspot readings, and overly aggressive boost logic can all pull your clocks down while your core temps still look completely fine. That is what real thermal throttling with normal temps looks like, and most gamers never check for it.
In this guide, we are going to walk through the hidden limits killing your FPS, how to spot them using HWiNFO and other tools, and what you can actually do about them. If you want an even bigger maintenance and optimization overview, park this guide as part of your main hub here: PC Maintenance and Optimization Guide.
Why Your PC Throttles Even When Temps Look Normal
Your hardware does not just care about temperature. It also cares about how much power it is pulling, how much current is flowing through it, how stable the voltage is, and how hot the power delivery parts around it get. When any of those hit a limit, your FPS drops, even if the main core temperature still looks safe. Throttling is often mistaken for a hardware limit. If you are unsure what your usage actually means, start here: how to tell if your CPU or GPU is the problem.
Here are the usual suspects behind thermal throttling with normal temps:
- GPU hotspot temperature runs much hotter than the reported core temperature.
- VRM temperature on your motherboard or graphics card quietly climbs until the power delivery backs off.
- Power limits like PL1, PL2, Tau, or AMD EDC, TDC, and PPT hit their ceiling and force clocks down.
- Voltage limits are reached, so boost algorithms pull back even at decent temperatures.
- Bad BIOS auto behavior sets aggressive boosts that then crash into limits under load.
The result is simple. Your FPS is not dying because the sensors in your overlay say 65 degrees. Your FPS is dying because somewhere else on the board, something is screaming for mercy and the firmware is slamming the brakes.
If stability matters, choosing the right mod manager helps. Full Vortex vs MO2 breakdown: Vortex vs MO2
GPU Hotspot Temperature, The Hidden Boss Fight
Your GPU has more than one temperature sensor. The number you see in most overlays is often the average or a core reading. The hotspot is a single sensor that represents the hottest point on the die, and it can be much higher than the core temperature. A 70 degree core with a 105 degree hotspot is perfectly possible, and that is when throttling kicks in.
When the hotspot reaches its limit, the card does not care that the average temp still looks reasonable. It immediately drops clocks and voltage to protect itself. That is why you can see sharp FPS drops under heavy load even though your main GPU temp looks completely fine.
How to check GPU hotspot:
- Install HWiNFO and open Sensor mode.
- Find your GPU section and look for entries like GPU Hot Spot Temperature or Junction Temperature.
- Start a game, play for 15 to 20 minutes, then alt tab and check the Maximum hotspot value.
Thermals, power limits, and driver timeouts all look the same when the screen goes black, so use this GPU crashing guide to identify the correct cause first.
If your hotspot is climbing over the mid 90s and heading toward the limit for your card, you are likely throttling. At that point, improving case airflow, lowering ambient temps, or slightly undervolting the GPU can help a lot. If you want a focused walkthrough on that, check out How to Undervolt Your GPU and Lower Temps.
Also remember that ray tracing and other heavy effects can pile extra heat and power usage onto the GPU. If you are leaning into cinematic visuals, it is worth reading Ray Tracing Isnt Magic, Just Expensive Lighting to understand what that load actually does to your card. Audio glitches during gameplay can sometimes come from driver conflicts or Windows settings. Our guide on fixing audio crackling in games walks through the most common fixes.
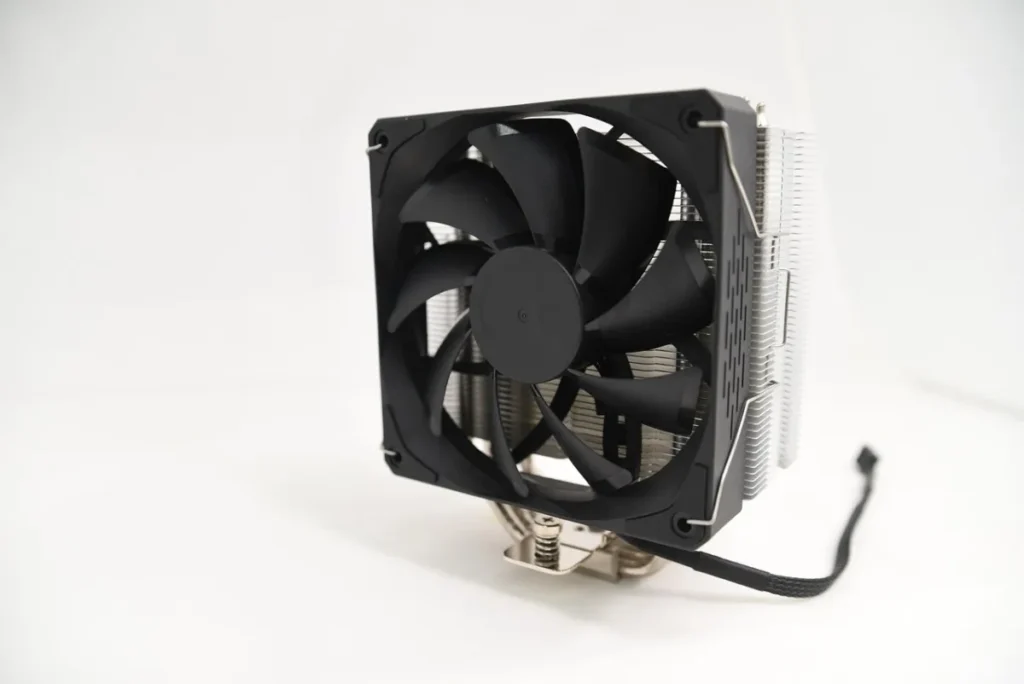
VRM Temperatures, The Slow Death of Your Clocks
VRMs, or voltage regulator modules, are the power delivery muscles on your motherboard and graphics card. They convert raw power from your power supply into stable, usable voltage for the CPU and GPU. When they run too hot, they do not announce it on your usual temp overlay. They simply sag, throttle, or force lower boost clocks. The OBS streaming workload can expose hidden performance limits, especially if you’re running a single PC streaming setup.
Cheaper boards and cards often ship with barely adequate VRM cooling. Add a warm case, a bit of dust, and a high core count CPU, and you have a perfect recipe for hidden throttling even when your CPU temperature looks under control.
How to spot VRM related issues:
- Clocks bounce up and down under a steady load for no clear reason.
- Benchmarks look fine at the start of a session, then fall off later.
- Side panel off and a fan pointed at the VRM area magically stabilizes performance.
Some boards expose VRM temperature sensors that you can see in HWiNFO. Others do not, so you have to rely on behavior and airflow experiments. Either way, if you are running a high wattage CPU on a budget board, VRMs are always on the suspect list. For more on how a stressed CPU behaves under load, it is worth reading How to Test Gaming PC Performance and Why Does My Game Stutter on a High End PC.
Power Limits, EDC, TDC, PPT, PL1, PL2 and All That Fun
Temperatures are only half the story. Power limits are the other half. Your CPU has a set of rules that define how much power it is allowed to pull and for how long. On Intel you will often see PL1, PL2, and Tau. On AMD you have EDC, TDC, and PPT. When those limits are hit, clocks will drop even if the CPU is sitting at 60 degrees.
What these limits roughly mean:
- PPT (AMD) is the total socket power limit.
- EDC and TDC (AMD) define current limits for short and sustained loads.
- PL1 and PL2 (Intel) are sustained and short term power limits.
- Tau is how long Intel is allowed to stay at PL2 before dropping to PL1.
On many motherboards, these values are set aggressively or inconsistently. Some boards unlock them completely, others pull them back hard to protect weak VRMs. Either way, when the CPU slams into these power walls, your frequency graph goes down while the temperature graph stays smug and stable.
You can monitor these limits in HWiNFO by watching fields like Power Limit Exceeded, EDC Limit, and TDC Limit. If those flags keep flipping to Yes during long gaming sessions, you have found one of the hidden throttles killing your FPS.
GPU Power and Voltage Limits, Silent FPS Killers

GPUs also have hard limits on how much power they can draw and how much voltage they can safely push. When they reach those limits, they simply stop boosting higher, or they drop to a lower performance state. Again, this can happen while the reported temperature is still in a comfortable range.
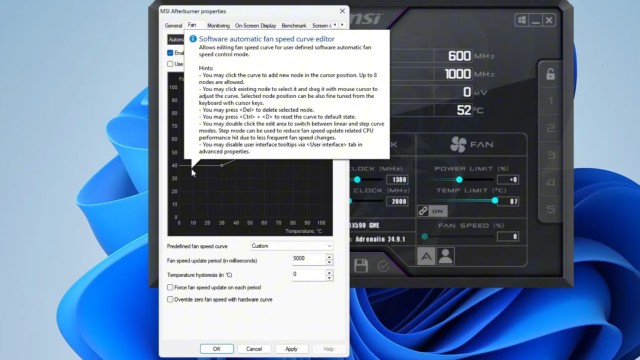
Tools like MSI Afterburner and HWiNFO let you see if your GPU is bouncing off its power limit constantly. If the power limit percentage is pinned at or near 100 percent while your clocks scale down, you are not thermally limited, you are power limited.
This is where undervolting shines. By feeding the GPU a bit less voltage at a given clock speed, you reduce power draw, which in turn gives the card more headroom to stay at that boost clock without tripping its own limit. It feels like free performance and lower temps at the same time. For a practical approach, use this guide next: How to Undervolt Your GPU and Lower Temps.
BIOS Settings That Cause Throttling With Perfect Temps
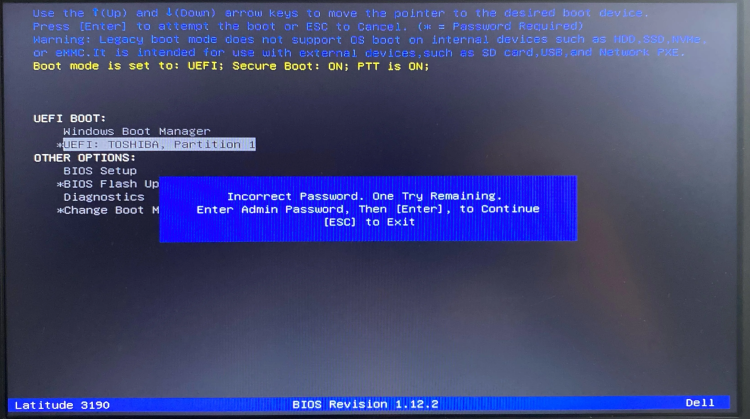
Motherboard vendors love to ship boards with slightly spicy auto settings. Extra boost, higher voltage, some clever sounding power feature, all switched on by default. It looks nice in short benchmarks, then hits a wall in long gaming sessions.
Here are a few BIOS settings that can quietly wreck your stability and cause throttling even when temperatures look fine:
- Overly aggressive boost limits that slam into power walls immediately.
- Load Line Calibration (LLC) set too high, causing voltage overshoot under load.
- XMP or EXPO profiles that push your memory controller harder than it can handle.
- SOC and VDDIO voltages dialed up too far for no good reason.
If you see random drops in performance, short spikes of high usage, or occasional crashes when the system should be stable, it is worth trying a slightly more conservative BIOS profile. Turn off the auto overclock options, reset to a known good baseline, then make small, measured changes instead of trusting the board to guess correctly.
How to Detect Silent Throttling Using HWiNFO
Now the fun part. You know the suspects, so here is how you actually catch them in the act.
Step one, set up logging:
- Open HWiNFO and choose Sensor mode.
- Click the small logging icon and choose a location for the CSV file.
- Make sure the columns you care about are visible, such as CPU clocks, CPU package power, GPU core clock, GPU hotspot temp, VRM temps if available, and power limit flags.
Step two, reproduce the problem:
- Start the log in HWiNFO.
- Launch the game that gives you trouble and play normally.
- Note the rough time when FPS starts to feel worse or when a large stutter hits.
Step three, read the evidence:
- Stop the log after the session.
- Open the CSV in your spreadsheet tool of choice.
- Look at the time around the FPS drop and compare clocks, power, and temperatures.
If you see clocks dropping while temperatures are stable, but power flags flip to Yes or hotspot and VRM values spike, you have confirmed that one of the hidden throttles is responsible. For more monitoring tricks and sanity checks, you can plug this into your workflow with Steam CPU Temperature Overlay, Kernel Panic vs Reality and your main monitoring hub once it is live.
If you enjoy this kind of deep dive, you will also want to keep an eye on the main pillar: PC Maintenance and Optimization Guide, which ties all the monitoring and tuning content together.
Real Fixes That Actually Work
Once you have proof that throttling is happening, fixing it is usually about giving your hardware an easier life instead of just cranking sliders up and praying.
- Improve case airflow by adding intake and exhaust fans, cleaning filters, and avoiding cable spaghetti in front of paths.
- Lower GPU and CPU voltage slightly to reduce power draw and heat, which lets them hold boost more consistently.
- Adjust power limits in BIOS or software, but only if your board and VRMs are strong enough to handle it.
- Replace old thermal paste if your system is a few years old and has clearly degraded thermals.
- Upgrade thermal pads on GPUs known for weak VRAM or VRM cooling, if you are comfortable tearing the card down.
Also, remember that not every stutter or drop is hardware. Sometimes the fix is as simple as limiting your FPS so the system is not constantly riding the edge of its boost limits. If your GPU is sitting at 99 percent usage with the power limit pinned, try the advice in Capping Your FPS and see how much smoother things feel when the card is not trying to sprint a marathon.
For cases where your system still feels oddly inconsistent even after all of this, revisit Why Does My Game Stutter on a High End PC and How to Test Gaming PC Performance to rule out software, storage, and background process issues.
The Hidden Throttles Killing FPS When Hardware Is Just Not Good Enough!
Sometimes the uncomfortable answer is that your hardware is the problem. Not because it is old, but because it was never built to handle the loads you are putting on it. Older or second-hand CPUs can throttle in sneaky ways, so use the checks in Buying a Used CPU for Gaming to verify clocks, temps, and stability before you trust the upgrade.
- A budget motherboard with a weak VRM trying to feed a high core count CPU.
- A thin GPU with minimal cooling running ray tracing and high refresh gaming together.
- A case with almost no airflow that looks pretty but cooks everything inside.
- A power supply that is barely adequate on paper and unstable under transient spikes.
If every test shows the same pattern, and you have already done the airflow, undervolt, FPS cap, and paste routine, you may have reached the ceiling of what that hardware can do. At that point, the best you can do is optimize settings and plan a future upgrade where it matters most, usually board, GPU, or case.
Your Temps Did Not Lie, They Just Did Not Tell the Whole Story

Modern PCs are way more complicated than a single temperature reading and a single boost clock. Thermal throttling with normal temps is not a myth, it is exactly what happens when hotspot sensors, VRM limits, and power rules kick in silently while your overlay insists everything is fine.
If your FPS collapses after a few minutes, or your game feels like it is constantly breathing through a straw, stop staring at one CPU temp. Check your GPU hotspot, watch your VRM behavior, and look for power limit flags in HWiNFO. Then use the tools and guides you already have, like How to Undervolt Your GPU and Lower Temps, Capping Your FPS, and the main PC Maintenance and Optimization Guide to pull your rig back into a stable, high performance sweet spot.
Your temps are not the only story. Once you learn to read the rest of the signals, you stop guessing and start fixing.